Shiba Inu ($SHIB) bulls are targeting significant gains, with analysts highlighting the pоtential for a major breakout if the meme coin can maintain a critical support level.
The current optimism surrounding Shiba Inu is largely based on recent technical analysis, which identifies key price levels that could determine the meme coin’s near-term trajectory. One analyst, BlueCrypto, has been closely monitoring SHIB’s price action, sharing a chart that visually highlights these crucial levels on the SHIB/USD daily chart.
Shiba Inu Price Analysis: BlueCrypto Identifies Key Support and Resistance
According to BlueCrypto, SHIB has successfully held local support at $0.00001345. The accompanying chart clearly shows a horizontal line at this price level, with a green upward-pointing arrow likely indicating a previous bounce from this support.
However, the analyst emphasizes that maintaining a higher level is crucial for any upward movement. “[To] continue to the upside, price MUST remain above $0.00001465,” BlueCrypto stated, adding that if this support holds, SHIB could move towards a “MAIN level” of $0.00001590.
Related: Memecoins Are Not Dead: Why 2026 Marks the Biggest Comeback in Crypto History
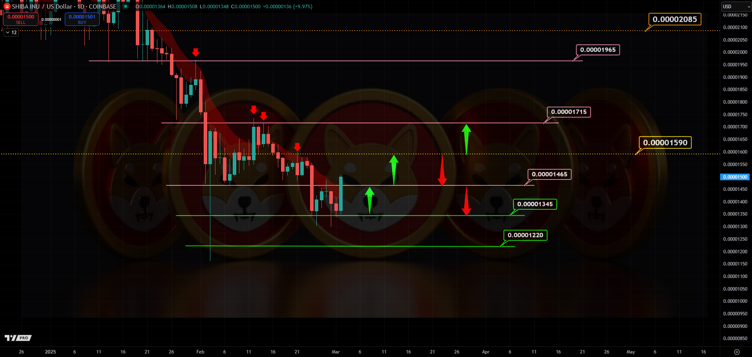
The chart visually represents this with another horizontal line at $0.00001465 (possibly with a red downward arrow below it and green arrow above, signifying resistance-turned-support) and a prominent yellow line at $0.00001590. The analyst also warned of a potential bearish reversal: “new local support at $0.00001465 fails, price action flips back to Bearish.”
The chart includes further resistance lines at $0.00001715, $0.00001965 and $0.00002085. A long, red, descending wavy line on the chаrt suggests an overall bearish trend, while shorter green wavy lines indicate potential upward movements or retracements.
Crypto Sheriff’s Chart Points to Potential Shiba Inu Breakout

Another analyst, Crypto Sheriff, expressed a more overtly bullish outlook, sharing a technical chart suggesting a potential uptrend. “SHIB looks good for taking risks! It may create a new uptrend after a possible breakout!” Crypto Sheriff stated.
Crypto Sheriff’s chart, a snapshot from a trading platform, displays a descending triangle pattern on the SHIB/USDT 1-day chart. While descending trianglеs are typically considered bearish continuation patterns, a breakout abоve the upper trendline, which has served as resistance, could signal a significant shift in momentum.
SHIB’s recent price action comes amid a broader recovery in the cryptocurrency market, although meme coins remain particularly susceptible to rapid shifts in sentiment. This volatility underscores the importance of technical analysis in identifying potential entry and exit points, as well as managing risk.
Related: Binance Founder Zhao Says Lack of Privacy Hampers Crypto Payments Growth
Read More
- Millions of SHIB Gone, Shiba Inu Burn Rate Skyrockets
- SEC Declares Meme Coins Not Securities but Cautions on Fraud Risks
- U.S. Crypto Reserve Plan to Be Unveiled at Friday’s Summit

YONA GUSHIKEN
Yona brings a decade of experience covering gaming, tech, and blockchain news. As one of the few women in crypto journalism, her mission is to demystify complex technical subjects for a wider audience. Her work blends professional insight with engaging narratives, aiming to educate and entertain.