

Shiba Inu (SHIB) just broadcast a triple-digit alert to the digital asset market as a 249.37% burn rate surge collided with a massive spike in trading volume. Daily volume reached $174.98 million by Wednesday morning. The surge drives a fundamental shift in network activity following several days of relative dormancy. Professional desks appear to be hardening the technical floor as the asset coils for a breakout above multi-month resistance.
Key Points
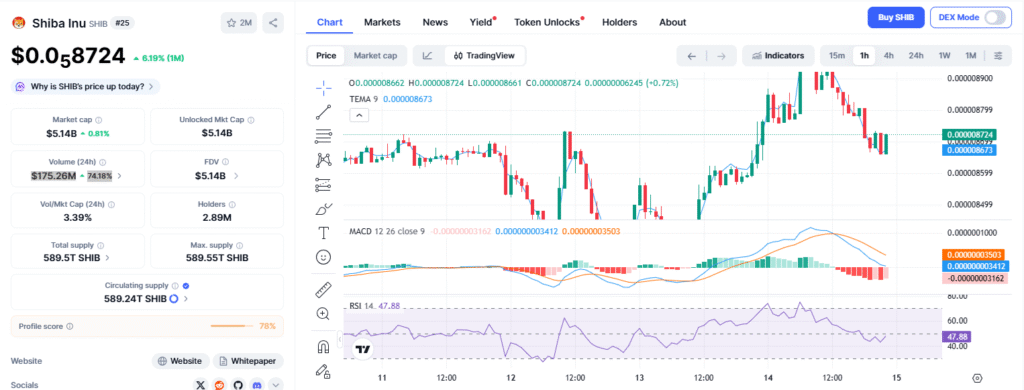
- Shiba Inu recorded a 74% volume spike to $175 million alongside a 249% surge in its burn rate on Wednesday.
- The asset is successfully defending the 50-day EMA support at $0.00000838 while consolidating near $0.00000872.
- Analysts interpret the high volume and stable price as an accumulation phase, with the asset coiling for a potential breakout above $0.00000924.
On-chain tracker confirms the removal of 432,211 tokens from the circulating supply during the recent 24-hour window. The sharp percentage increase drives a decisive reversal in network activity. Ecosystem mechanics are currently realigning with broader market sentiment as volatility returns to the meme-token sector.
Shiba Inu Liquidity Spikes During Accumulation Phase
Significant liquidity injections accompany the uptick in deflationary pressure. SHIB traded at $0.000008722 during the Wednesday morning session. The price represents a 0.89% daily gain and a 6.14% increase over the past 30 days. The asset’s market capitalization reached $5.13 billion as buyers successfully absorbed sell-side pressure.
Market analysts interpret heavy trading activity alongside stable price action as a period of accumulation. Large holders appear to be absorbing supply without aggressively forcing the spot price higher. The 24-hour volume of $174.98 million provides the depth required for institutional-sized orders. The current volume profile suggests that professional participants are positioning for a directional move later in the week.
Related: Memecoins Are Not Dead: Why 2026 Marks the Biggest Comeback in Crypto History
Technical Indicators Reveal Trend Strength
The technical chart displays a defense of the $0.00000838 floor. Buyers used the 50-day Exponential Moving Average (EMA) to snap a previous downtrend. Success in holding the $0.00000838 line confirms that the medium-term trend remains intact despite recent macro volatility. Bulls face immediate friction at the $0.00000924 level. Market sellers capped every upside attempt in this zone since late November.
On-chain momentum indicators favor the bulls. The Relative Strength Index (RSI) currently sits at 47.88. The current reading suggests the asset has significant room to move higher before reaching overbought territory.
Related: Binance Founder Zhao Says Lack of Privacy Hampers Crypto Payments Growth
The Moving Average Convergence Divergence (MACD) remains in a stabilization phase. A bullish crossover appears likely if buying pressure sustains through the next several sessions. Analysts are monitoring the histogram for expanding green bars to confirm a change in trend direction.
Price Breakout Scenarios and Market Risk
Confluence among these metrics creates a constructive outlook for the asset. A 74% volume spike often precedes a significant volatility event. A daily close above the $0.00000924 resistance could trigger a swift move toward the 200-day EMA at $0.00001049. Reclaiming the 200-day EMA effectively erases the losses sustained during the December correction.
Failure to hold the $0.00000838 support under heavy volume would confirm a bearish breakdown. The market remains focused on the $0.00000755 lows as the ultimate line in the sand for long-term holders. The accelerating burn rate provides a fundamental tailwind that supports an upside resolution to the current consolidation. Buyers are looking for a break of the psychological $0.00001 ceiling to confirm the start of a new bull cycle.
Frequently Asked Questions

YONA GUSHIKEN
Yona brings a decade of experience covering gaming, tech, and blockchain news. As one of the few women in crypto journalism, her mission is to demystify complex technical subjects for a wider audience. Her work blends professional insight with engaging narratives, aiming to educate and entertain.