

A widely followed crypto analyst is pointing tо a classic technical pattern on the Shiba Inu (SHIB) charts that he says could send the price of the popular token soaring more than 135%. The prediction hinges on a “bullish divergence” that suggests downward momentum may be waning, setting the stage for a significant reversal.
The analysis came from crypto analyst @JavonTM1, who shared his findings in a post on X on July 11. He presented a detailed price chart for Shiba Inu ($SHIB) and offered a specific, data-driven forecast based on the patterns he identified.
He laid out the potential target with precision. “In a nearer term and by confirmed data, the $0.000032s are levels to come in for $SHIB (Shiba Inu) in response to a bullish divergence,” he wrote. Reaching this price from its current levels would represent a substantial gain for the token.
Decoding the Bullish Divergence on the Chart
The chart provided by JavonTM1 is central to his thesis. It displays two key components: the price action of SHIB in the upper section, and a technical indicator known as the MACD (Moving Average Convergence Divergence) in the lower section.
Related: Binance Founder Zhao Says Lack of Privacy Hampers Crypto Payments Growth
A bullish divergence occurs when the price of an asset prints a lower low, while the indicator below it simultaneously prints a higher low. On the supplied chart, the crypto analyst marked this exact phenomenon.
The Shiba Inu price is shown making two distinct descending bottoms, forming a pattern of lower lows. However, during the samе period, the MACD indicator below shows two ascending bottoms, forming higher lоws.
Related: Kusama Reveals Dеtails Of New AI Product in Recent Livestream
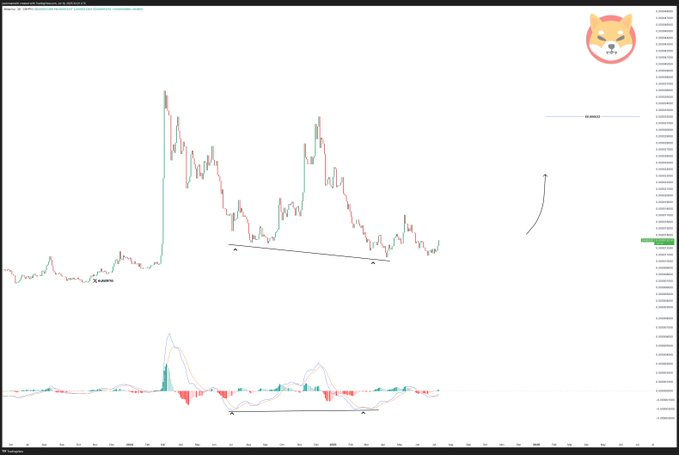
In technical analysis, this discrepancy is often interpreted as a signal that the bearish, or downward, momentum is weakening. Even though the price is still falling, the underlying momentum is beginning to shift, which can foreshadow a potential trend reversal to the upside.
“Only the Start”: A Look at the Potential Upside
The crypto analyst emphasized that hitting this initial target might only be the beginning. He framed the more than 135% move not as a ceiling, but as a potential floor for a larger recovery.
“Just that mоve itself is over 135% and could be only the start оf a larger bullish reversal,” he added in his post.
This analysis provides a specific, technical counterpoint to the broader market sentiment, which has seen SHIB and many other altcoins trade sideways. For traders who rely on chart patterns and indicators, a bullish divergence is a significant event. The focus will now be on whether the price action confirms the signal identified by the analyst, potentially kicking off the significant rally he has forecasted.
Read More
- Shiba Inu Price Prediction Sees SHIB Surging ‘Nearly 180%’
- Shiba Inu Price Analysis: SHIB’Breaking Out with Full Meme Force’
- Shib Alpha Laуer Block Explorer (Beta) Is Now Live

YONA GUSHIKEN
Yona brings a decade of experience covering gaming, tech, and blockchain news. As one of the few women in crypto journalism, her mission is to demystify complex technical subjects for a wider audience. Her work blends professional insight with engaging narratives, aiming to educate and entertain.