

After months of downward pressure, Bone ShibaSwap (BONE) is showing its first technical signs of strength in quite some time. Traders analyzing the charts say key momentum tools are beginning to flash bullish signals, hinting that the worst of the sell-off could be behind the token — at least for now.
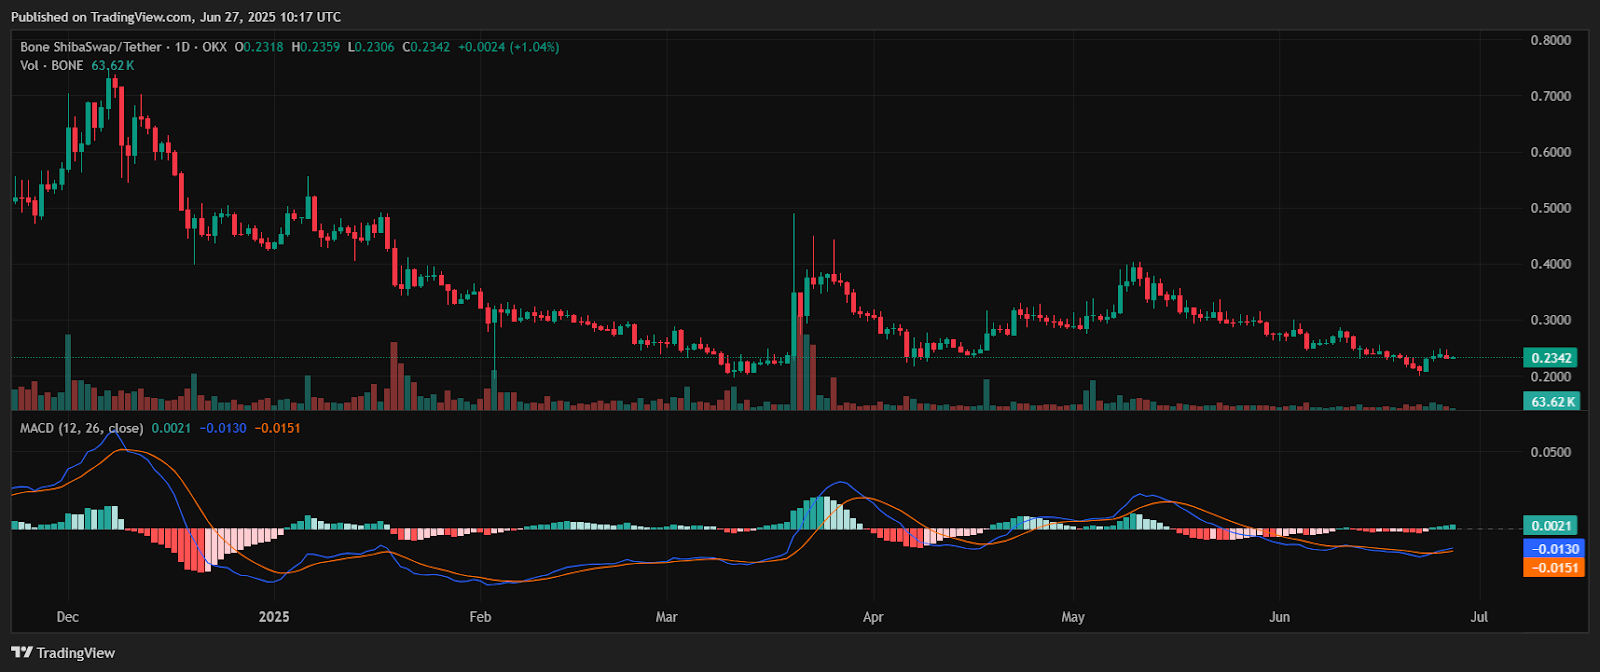
As the gas token powering the Shibarium blockchain, BONE plays a crucial role in the broader Shiba Inu ecosystem. But utility hasn’t protected its price. From late 2023 highs near $0.80, BONE has steadily declined, recently bottoming out near the $0.20 level. Attempts at reversal were met with selling, frustrating long-term holders and dampening short-term sentiment.
Now, however, the Bone technical indicators are starting to tell a different story — one of stabilization, and perhaps, early recovery.
Related: Binance Founder Zhao Says Lack of Privacy Hampers Crypto Payments Growth
MACD and RSI Indicators Flash Bullish Signals
Among the first clues: a bullish crossover on the MACD (Moving Average Convergence Divergence) — one of the most widely used tools for spotting momentum shifts. In late June, the faster-moving MACD line crossed above the slower signal line, indicating that buying momentum may be overtaking the selling pressure that’s dominated for months.

That crossover didn’t happen in isolation. The Relative Strength Index (RSI), another core momentum indicator, also began to pivot. After weeks of hovering in oversold territory — a zone typically associated with excessive bearishness — the RSI is now turning upward. That shift signals that buyers may be stepping back in, and that the token could be gaining strength from a technical standpoint.
These two developments — a MACD crossover and a rising RSI — are often seen as a potential bottoming pattern when they occur together.
What These Bone Technical Indicators Might Mean for Traders
While these tools offer insight, they’re not infallible. Technical indicators provide signals, not guarantees. For BONE to mount a proper rally, it needs more than signals — it needs conviction. That means breaking above nearby resistance levels and attracting stronger trading volume.
Traders will bе closely watching whether BONE can reclaim the $0.25 to $0.28 zone, which previously acted as support but may now serve as resistance. A clean breakout above that range, accompanied by volume, would be a stronger confirmation of a trend reversal.
Related: Kusama Reveals Details Of New AI Product in Recent Livestream
For now, though, the Bone technical indicators suggest that momentum may be shifting. It’s not yet a breakоut — but it’s the first real spark in weeks.
Read More
- New Shiba Inu Price Prediction Hints at Explosive 600% Growth
- Shiba Inu Price Could Rally 50+% Despite Whale Selloff
- Shib Alpha Layer & Rollups: Clearing the Traffic for a Smarter Web3

YONA GUSHIKEN
Yona brings a decade of experience covering gaming, tech, and blockchain news. As one of the few women in crypto journalism, her mission is to demystify complex technical subjects for a wider audience. Her work blends professional insight with engaging narratives, aiming to educate and entertain.