
The Shiba Inu price is flashing a powerful technical signal that could pave the way for a major rally—even as its largest holders quietly head for the door.
The meme coin’s chart had shown a textbook “double-bottom” pattern, a formation often associated with sharp upward reversals. While some whales were trimming their positions, traders watching the charts believed the Shiba Inu price could jump more than 50% if the pattern played out.
The double-bottom—shaped like the letter “W”—suggested the token had found a strong support zone and might be building toward a breakout. One of the first to flag the setup was crypto watcher creepy_cyborg, known for their technical breakdowns.
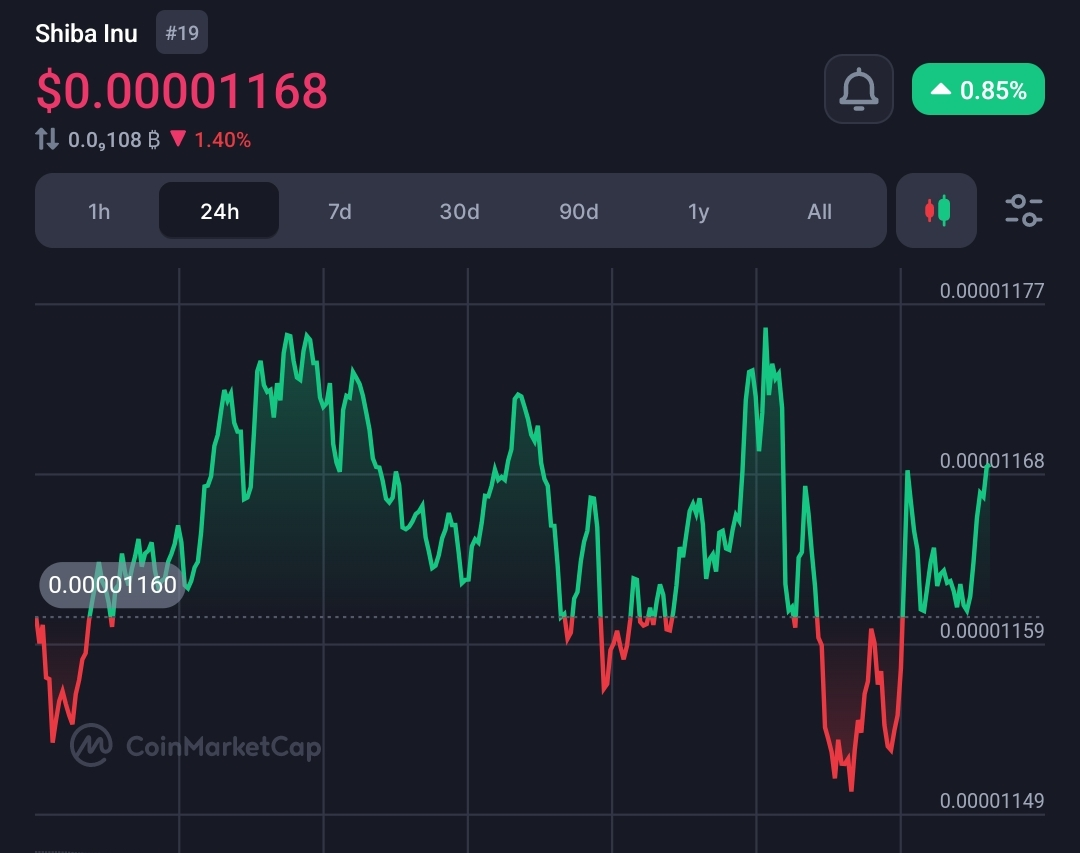
“Shiba Inu could rally 52% despite a whale sell-off, thanks to a bullish double-bottom pattern forming on the chart,” creepy_cyborg wrote. “SHIB is currently trading at $0.00001175, up 15% from this week’s low. Technical indicators like MACD and RSI show bullish momentum, with a price target of $0.00001765 if the breakout confirms.”
Alongside his commentarу, creepy_cyborg shared a snapshot of SHIB’s recent 24-hour price swings. The chart showed high-volatility consolidation—a classic prelude to a breаkout move in speculative markets like crypto.
Related: Binance Founder Zhao Says Lack of Privacy Hampers Crypto Payments Growth
Technical Indicators Fuel Optimism Around Shiba Inu Price
The double-bottom wasn’t the only thing that caught attention. оther key indicators leaned bullish as well. The MACD (Moving Average Convergence Divergence), often used to spot shifts in trend strength, appeared to flip into positive territory.
Meanwhile, the RSI (Relative Strength Index) bounced from oversold levels, suggesting renewed buying momentum. If bulls had pushed through the consolidation zone, SHIB could have targeted the $0.00001765 mark—a move that would have represented a 50.2% gain from its recent position.
At the time, analysts believed the coming sessions would be critical, espeсially if broader crypto sentiment—anchored by Bitcoin’s rebound—continued to strengthen.
Whales Trim Shiba Inu Holdings, Raising Eyebrows
Despite the bullish setup, on-chain data revealed that several of SHIB’s largest holders were reducing their exposure. These whales—who often influence liquidity and market direction—had been spotted moving significant amounts of SHIB out of wallets, a sign often interpreted as profit-taking or defensive repositioning.
Large-scale selling typically weighs on price momentum and can rattle retail confidence. Still, the outflows hadn’t sparked a full breakdown at the time—suggesting that short-term traders and smaller holders were holding the line.
Related: Kusama Reveals Details Of New AI Product in Reсent Livestream
In a more detailed chart, creepy_cyborg shared a more detailed chart illustrating thе double-bottom formation, complete with key resistance and support levels. His analysis pointed tо a cluster of bullish signals, including a flattening MACD and a rising RSI—both indicating the possibility of a breakout, if momentum held.
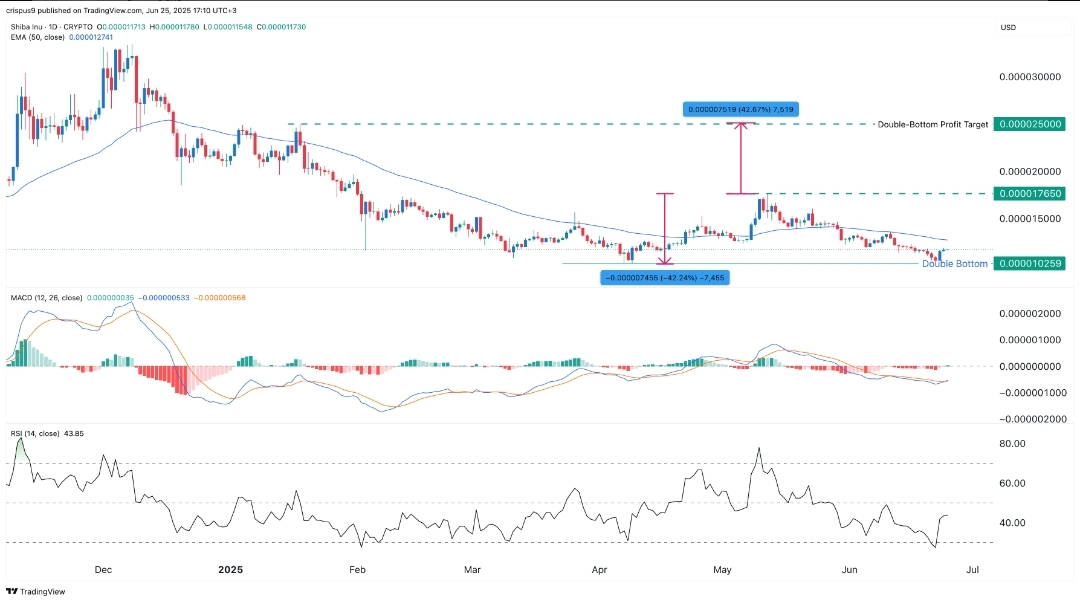
“Whales have been reducing their holdings,” he noted, “but this may be outweighed by strong technicals and broader market optimism, especially if BTC continues its upward trend. As long as SHIB stays above $0.00001025, the bullish setup remains valid.”
Kеy Support Level Holds the Line for Shiba Inu Price
The $0.00001025 level remained the line in the sand. As long as SHIB stayed above this threshold, the bullish setup remained intact.
A sustained drop below it would have likely invalidated the double-bottom pattern, along with hopes of a strong breakout. At that point, the Shiba Inu price sat between two competing forces—bullish chart signals and cautious whale behavior.
Which force prevailed depended less on sentiment and more on how much support retail traders could bring to the table.
Read More
- The Tech Powering the New Shib Alpha Layer
- Shib Alpha Layer & Rollups: Clearing the Traffic for a Smarter Web3
- New Shib Rollups Unlocks Custom Blockchains on Shibarium

YONA GUSHIKEN
уona brings a decade of experience covering gaming, tech, and blockchain news. As one of the few women in crypto journalism, her mission is to demystify complex technical subjects for a wider audience. Her work blends professional insight with engaging narratives, aiming to educate and entertain.